OpenTelemetry
Experimental: OpenTelemetry is an evolving product, and so is our implementation of it.
DiracX can report what it is doing using OpenTelemetry (OTEL), the vendor neutral standard for traces, metrics and logs. This page explains how this telemetry is produced and the choices behind it. The details of every span and metric are in the OpenTelemetry reference, and the monitoring how-to guides explain how to set it up and use it.
From DiracX to your dashboards
 routers (uvicorn) ─┐
 tasks-scheduler  ──┤   OTLP         ┌─────────────────────┐   metrics   ┌────────────┐
 tasks-worker(s)  ──┴──────────────▶ │ OpenTelemetry       │ ──────────▶ │ Prometheus │──┐
                                     │ collector           │   traces    ┌────────────┐  ├─▶ Grafana
                                     │                     │ ──────────▶ │ Jaeger     │──┤
                                     │                     │   logs      ┌────────────┐  │
                                     │                     │ ──────────▶ │ Elastic    │──┘
                                     └─────────────────────┘             └────────────┘
Every DiracX process sends its telemetry to an OpenTelemetry collector using OTLP, over gRPC or over HTTP. DiracX does not talk to any backend directly: the collector decides where the data goes (Prometheus, Jaeger, Tempo, Elasticsearch, a commercial service...), batches it, and can filter or enrich it. This keeps DiracX independent of the monitoring infrastructure of each site.
The DiracX helm chart can deploy a collector together with Prometheus, Jaeger, Elasticsearch and Grafana, which is what the demo uses (run_demo.sh --enable-open-telemetry).
For development, pixi run local-start --otel runs a minimal collector which simply prints what it receives.
One setup for all the processes
All the long running processes (API servers, scheduler and workers) initialise OpenTelemetry in the same way, from the DIRACX_OTEL_* settings.
The short lived diracx-tasks call and diracx-tasks submit commands do not: each invocation would create new metric series which are never updated again.
Each process identifies itself with resource attributes, attached to everything it sends:
service.name: the name of the installation (DIRACX_OTEL_APPLICATION_NAME), identical for all the processes of an installation;diracx.component: which kind of process it is (routers,tasks-workerortasks-scheduler);service.instance.id: the process, as<host>-<pid>. It must be unique per process, otherwise the counters of two processes running on the same host (several workers, several uvicorn workers...) would overwrite each other. The host alone (the pod in kubernetes) is inhost.name;service.version: the DiracX version, useful to compare the behaviour before and after an upgrade.
The code instrumented by DiracX (diracx-db, diracx-tasks, diracx-routers) only depends on the OpenTelemetry API, which does nothing until a process installs the SDK.
The SDK and the exporters are installed with the otel extra of diracx-core (diracx-core[otel], included in the DiracX container images), which sets them up for all the processes.
The SQL queries are traced by listening to SQLAlchemy events globally, so the engines of all the databases are covered without instrumenting each of them.
Traces: following a piece of work
A trace is the story of one piece of work, made of spans (timed operations) nested in each other. DiracX aims at having one trace per piece of work as the user understands it, even when it crosses several processes.
HTTP requests
Each HTTP request is a span, created by the OpenTelemetry FastAPI instrumentation and named after the route (POST /api/jobs/jdl).
Once the token of the request is validated, the span is tagged with the user (enduser.id, the sub of the token), the VO and the group,
so that one can look for the requests of a given user or community.
Some requests are deliberately not traced:
- the kubernetes probes (
/api/health/...) are called every few seconds: they would drown the meaningful traces, and skew the latency metrics; - the ASGI instrumentation normally creates a span per ASGI message sent or received, which gives hundreds of meaningless spans for a streamed response. These are disabled.
SQL queries
Every SQL query is a span named after the operation and the database (SELECT JobDB), with the query text.
DiracX only uses parametrised queries, so the values (which may contain sensitive data) are not recorded.
A query span is only created when there is already an active span, i.e. within a request or a task. Otherwise, the periodic housekeeping of the connection pools would create a flood of meaningless one-span traces.
Tasks
The task system is where tracing matters the most, and where it is the most difficult: a task is submitted by one process (an API server, the scheduler or another task) and executed later by another one (a worker).
To connect the two, the submitter stores its trace context (W3C traceparent) in the task message, and the worker starts a new trace with a link to the task.submit span:
POST /api/jobs/jdl                         routers        (SERVER)
├── INSERT JobDB                           routers        (CLIENT)
└── task.submit jobs:SomeTask              routers        (PRODUCER)
        ▲
        ┊ link
task.process jobs:SomeTask                 tasks-worker   (CONSUMER)
└── task.execute jobs:SomeTask             tasks-worker
    ├── SELECT JobDB                       tasks-worker   (CLIENT)
    └── task.submit jobs:ChildTask         tasks-worker   (PRODUCER)
            ▲
            ┊ link
    task.process jobs:ChildTask ...
A few choices are worth explaining:
- The execution is a separate trace linked to the submission, not a child of it.
OpenTelemetry allows both. A child relationship would show the whole story in one trace, but a trace would then last as long as the task waits to be executed (a task scheduled for the next day would give a trace spanning a day), and a request submitting many tasks would give a very large trace.
Such traces are hard to work with in tracing backends, and the OpenTelemetry messaging conventions describe links for this case.
In a backend which supports links (Jaeger, Tempo...), one can follow them from a
task.processspan to the submission, and back. - Periodic tasks start a new trace, from the scheduler: each run of a periodic task is its own story.
- Each retry is its own trace, linked to the previous attempt. The retry is linked to the attempt which failed, which is linked to the previous one, and so on up to the original submission.
task.retry_countgives the number of the attempt. task.processandtask.executeare two spans.task.processcovers the whole handling of the message by the worker: execution, but also retry scheduling, dead letter queue, callbacks and result storage.task.executeonly covers the code of the task, and is the one marked as failed (with the traceback) when the task raises an exception. The time a task waited in its queue before being picked up is recorded ontask.process(task.queue_wait_s).
Messages produced by an older version of DiracX (without trace context) are still processed: their trace simply has no link.
Logs
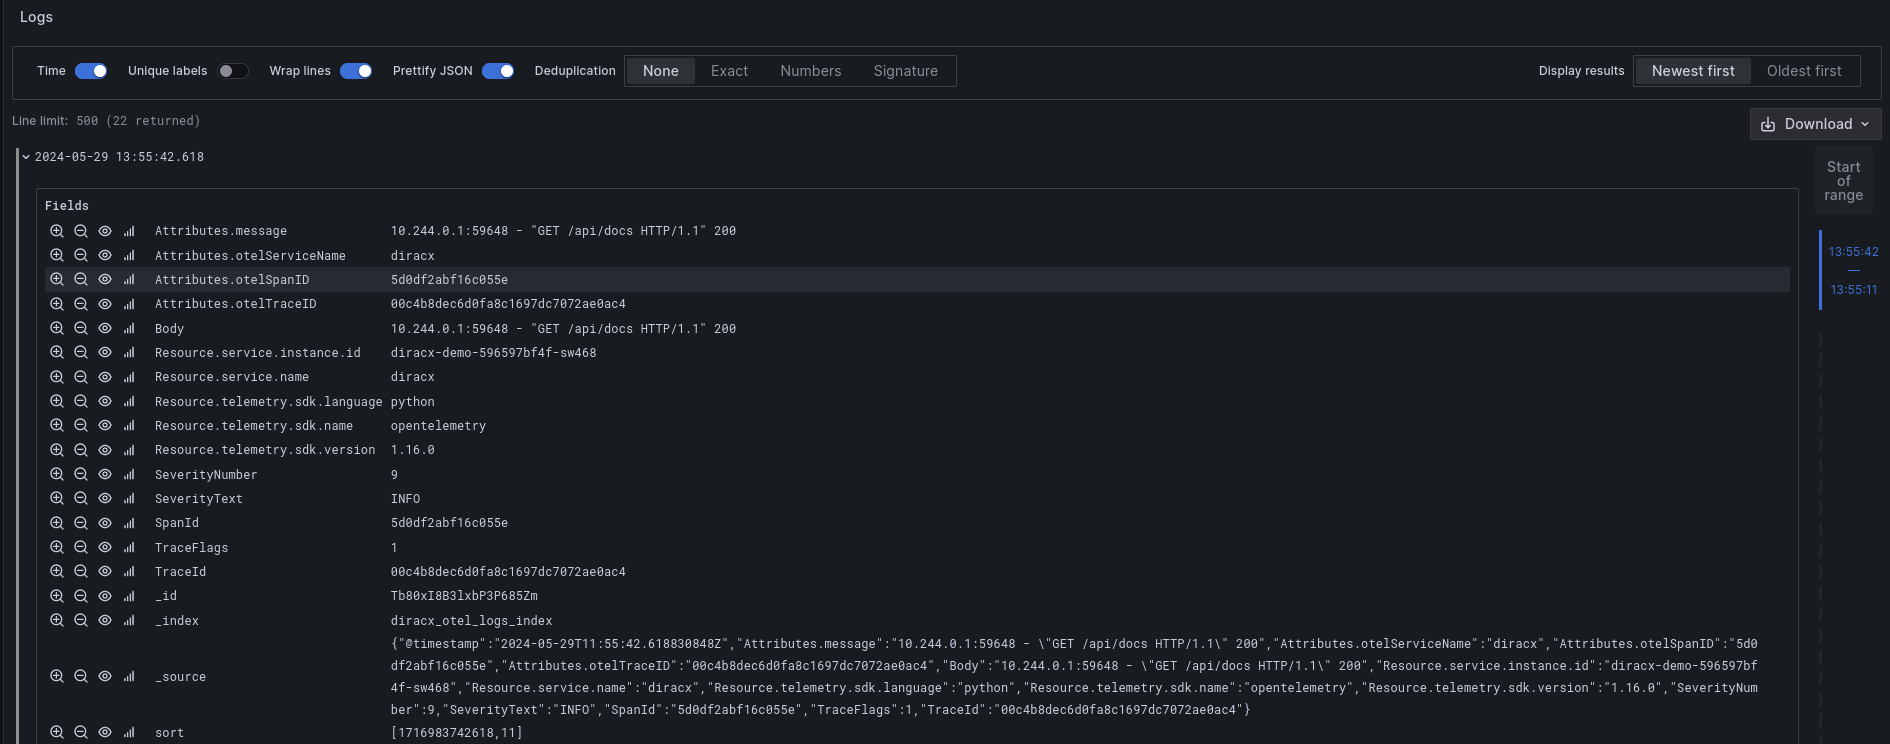
The logs emitted within a span carry the trace and span IDs. In a backend which stores both (e.g. Grafana with Tempo and Loki, or Elasticsearch), one can jump from a failed span to the logs of the request or task, and back.
Metrics: the health of the system
Traces tell the story of one piece of work; metrics tell how the system behaves as a whole, and are what dashboards and alerts are built from.
Who reports what
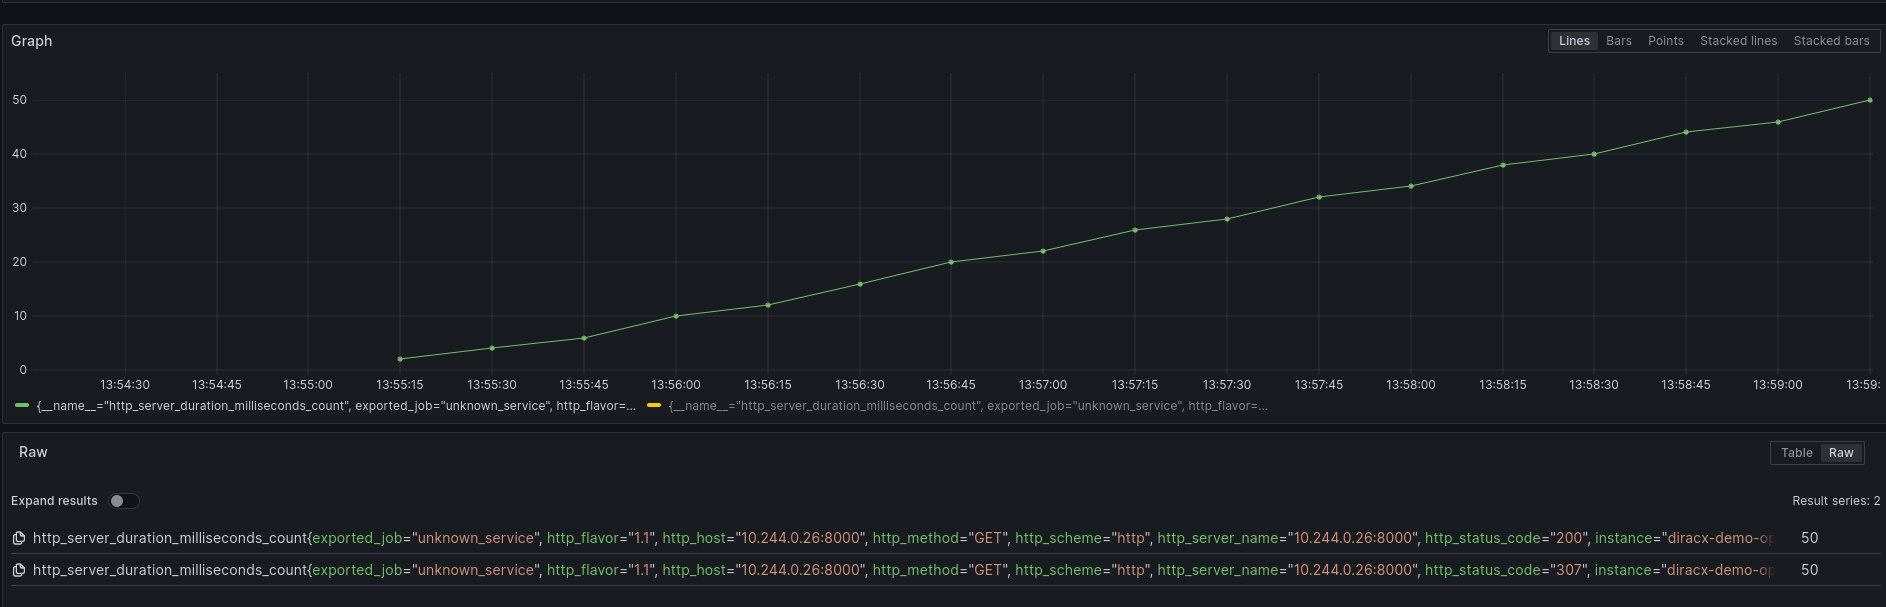
- The API servers report the HTTP traffic (from the FastAPI instrumentation): number of requests, duration, status codes, per route. They also count the requests per version of the DiracX client, to know when older clients can stop being supported.
- The workers report what they execute: tasks completed and failed, execution time, time spent in the queue, retries, tasks given up, and how busy they are compared to their capacity.
- The scheduler reports the state of the queues: length, backlog and in-progress count of each stream, delayed tasks, and the content of the dead letter queue. The scheduler is a singleton, so these values are reported exactly once, whereas they would be counted as many times as there are workers if the workers reported them. Only the instance holding the scheduler lock reports them.
- Every process reports its SQL queries (duration, errors) and the state of its connection pools.
- Anyone submitting a task counts it (
tasks_submitted_total), so that the submission rate can be compared with the execution rate.
Keeping metrics cheap
Each distinct combination of attribute values is a separate time series, which costs memory and storage in Prometheus. DiracX metrics therefore only use bounded attributes: the task name, priority and size, the HTTP route (the template, not the URL), the database name... Values like task IDs, job IDs or users are never metric attributes: they belong to traces.
Some subtleties
- A task which cannot acquire its lock is not a completed task: it is counted as a retry (
reason="lock_contention"), and its (very short) duration is not recorded. Otherwise, a task constantly fighting for a lock would look healthy and fast. - Durations use buckets adapted to their range: from a few milliseconds to an hour for tasks, from half a millisecond to 10 seconds for SQL queries. OpenTelemetry's default buckets are meant for milliseconds, and would put nearly every task in the same bucket, making the percentiles meaningless.
- The time spent in the queue (
task_queue_wait_seconds) compares the time at which Redis received the message (from the clock of the Redis server) with the time at which a worker picked it up (from the clock of the worker): a clock skew between the two biases it. - The backlog of a stream (
task_stream_lag) is the number of messages not yet delivered to any worker, and requires Redis 7. It is different from the in-progress count (task_stream_pending), which counts the messages delivered to a worker but not acknowledged yet.
Metric names in Prometheus
OpenTelemetry names (db.client.operation.duration, unit s) are translated by the collector into Prometheus names (db_client_operation_duration_seconds): the dots become underscores and the unit and _total suffixes are added.
The resource attributes become labels only if the collector is configured to do so (resource_to_telemetry_conversion), which is what the DiracX chart and dashboards rely on: service_name, service_instance_id and diracx_component are then available on every series.
Current limitations
- OpenSearch queries and outgoing HTTP requests (e.g. to the identity provider) are not traced.
- By default, every trace is kept. On a busy installation, sampling should be enabled (see the how-to).